Loading
Back to Expertise
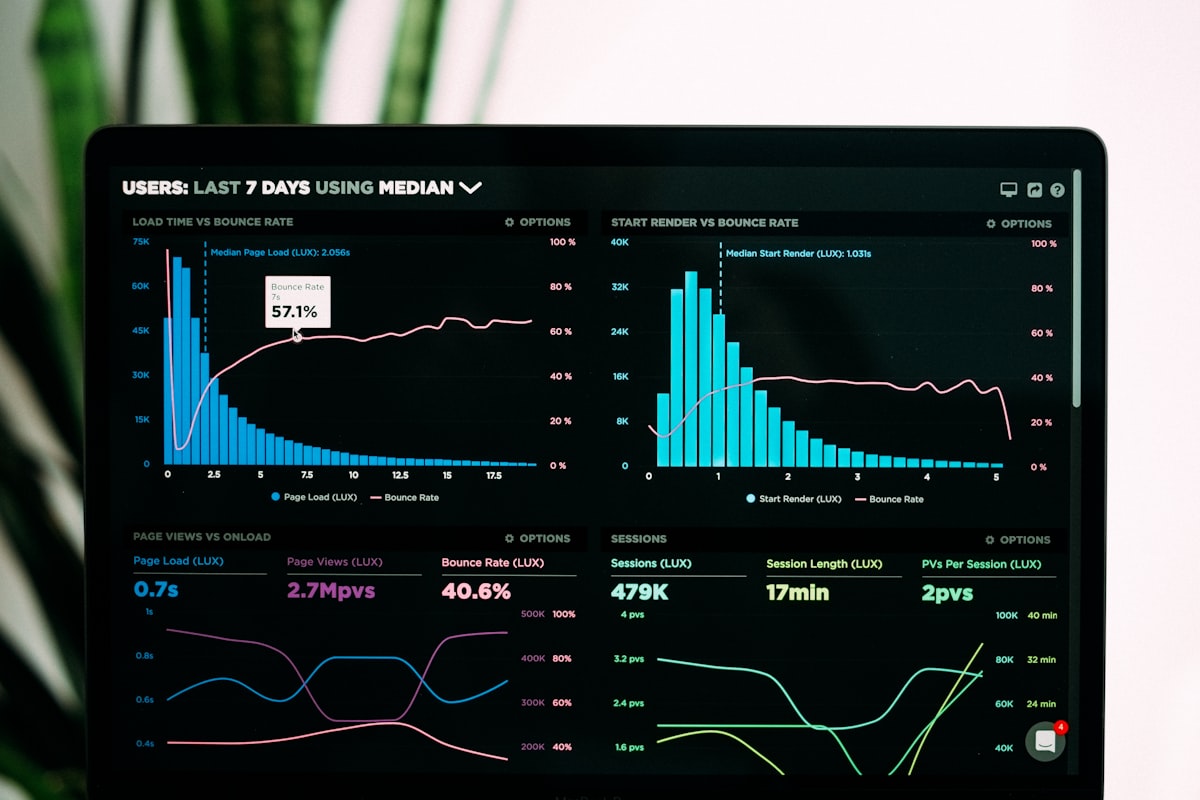
Data Analysis and Business Intelligence
Transforming raw numbers into actionable, competitive insights.
Data sitting in silos is a liability. Data transformed into visual intelligence is a supreme competitive advantage. We build the pipelines and dashboards that turn raw operational exhaust into clear boardroom insights.
Key Benefits
1
Real-Time Visuals
Replacing static monthly Excel reports with living, breathing dashboards connected directly to live databases.
2
Cross-Department Aggregation
Pulling financial data, marketing metrics, and server telemetry into a single unified analytical view.
3
Predictive Capability
Implementing statistical models that highlight anomalies and forecast future trends based on historical baselines.
What is Data Analysis and Business Intelligence?
Organizations operate in an environment where data is the backbone of competitiveness. We deploy advanced decision-making dashboards and Business Intelligence (BI) platforms to help you visualize trends and optimize your strategic directions.
Development Process
Metabase & Superset Deployment
Installing top-tier open-source BI platforms that rival expensive tools like Tableau or PowerBI.
Data Lake Architecture
Engineering the storage layers (like S3/Ceph) to hold vast amounts of unstructured analytical data cheaply.
Analytical Query Tuning
Optimizing ClickHouse or PostgreSQL to handle massive columnar reads without locking up transactional tables.
Technology Stack
Apache Superset
Metabase
Redash
PostgreSQL
Powerful, open source object-relational database system.
ClickHouse
dbt
Apache Airflow
ETL
Python
High-level programming language used for scripting, AI logic, and backend automation.
SQL
Technical Deep Dives
ETL Pipeline Architecture for Real-Time BI
Business Intelligence is only as good as the data feeding it. Traditional ETL (Extract, Transform, Load) processes run nightly batch jobs, meaning executives make decisions based on yesterday's data. Our modern approach uses ELT (Extract, Load, Transform) combined with streaming: data is extracted from source systems (database CDC, API polling, log streams) and loaded into a data warehouse (ClickHouse, PostgreSQL) in near real-time. Transformations happen inside the warehouse using dbt (data build tool), which versions transformation logic in Git just like application code. Apache Airflow orchestrates the entire pipeline: scheduling data extraction, monitoring transformation jobs, handling retries and failures, and alerting data engineers when pipeline SLAs are breached. The result: Apache Superset dashboards that refresh every few minutes with accurate, transformed data, giving executives a live pulse of the business.
Why Choose Us?
- Data DemocratizationWe configure these tools so that non-technical managers can use intuitive drag-and-drop interfaces to build their own insights, reducing the burden on the data engineering team.
Frequently Asked Questions
Yes. Apache Superset provides comparable visualization capabilities with rich charts, interactive dashboards, and SQL Lab for ad-hoc analysis — without per-seat licensing.
We support connections to virtually any SQL database, plus external APIs, CSV uploads, and real-time streaming sources via Kafka or Airflow connectors.
Yes. Apache Superset and Metabase both provide drag-and-drop chart builders that allow business analysts to create and share dashboards without writing SQL.
We implement row-level security (RLS) and column-level permissions, ensuring each user sees only the data they're authorized to access, based on their LDAP group membership.
Yes. Both Superset and Metabase support embedded analytics via iframes or SDKs, allowing you to offer data visualization directly within your product.
Conclusion
Make decisions based on mathematical certainty, not gut instinct. IQAAI Technologies delivers the Business Intelligence layer your executives need to pilot the enterprise accurately.
Ready to Get Started?
Schedule a free consultation with our engineers to discuss your data analysis and business intelligence requirements.